
Simple pendulum experiment
Time a simple pendulum at six lengths, plot the L–T² graph, and get g and the seconds pendulum from it, with a worked practical record and viva answers.
By Rahul Sain · Updated Nov 3, 2026
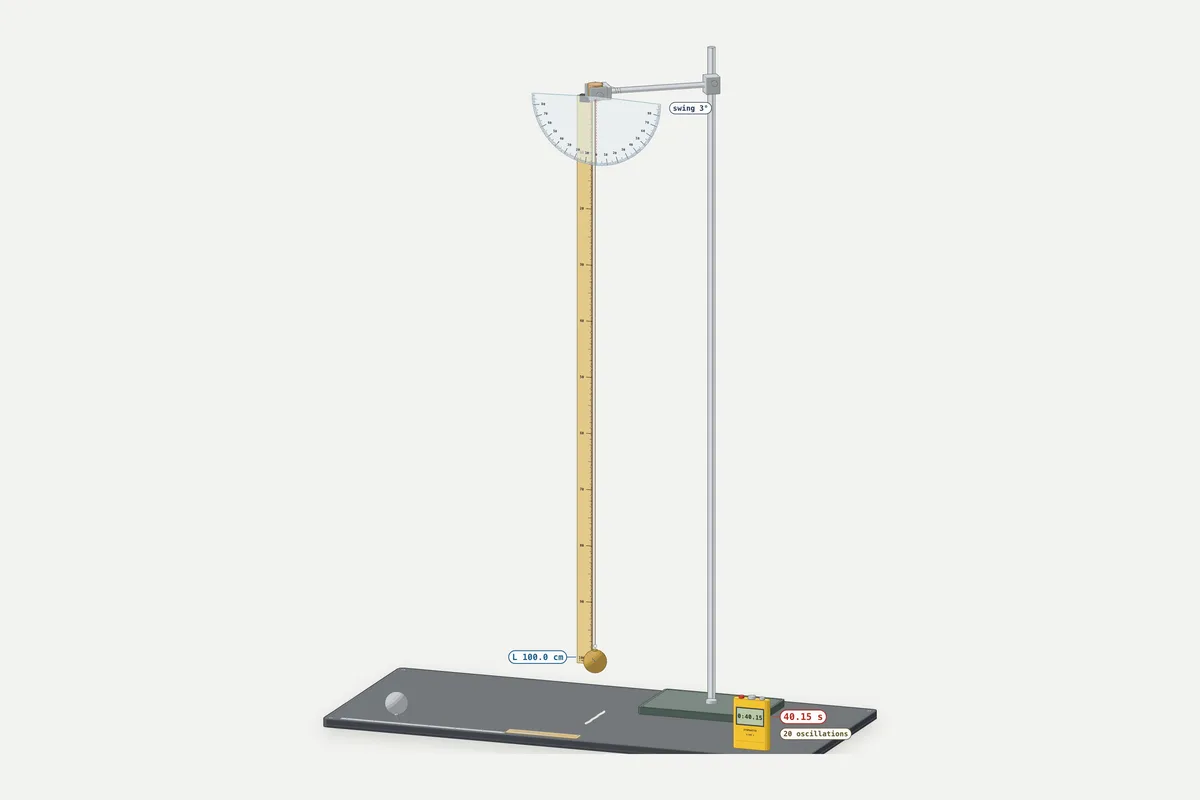 Free 3D labTry it in the 3D labThe simple pendulum: take the readings yourself, free, no sign-in needed.
In the simple pendulum experiment you hang a metal bob on a long thread, time 20 to 30 oscillations at five or six different lengths, and divide to get the time period T at each length. Because T = 2π√(L/g), a graph of L against T² is a straight line through the origin. Its slope gives the acceleration due to gravity, g, and the point where T² = 4 s² gives the length of the seconds pendulum, about 99 cm.
This guide follows Experiment 6 of the NCERT Laboratory Manual Physics Class XI and the CBSE Physics curriculum for 2026-27. It is laid out the way a practical file is written, and every number is worked in full.
Quick answers
- Time period formula: T = 2π√(L/g), for small swings. L is the effective length and g the acceleration due to gravity.
- Effective length: L = l + r + e: the thread's length, plus the bob's radius, plus the hook's length. It runs from the point of suspension to the centre of the bob.
- L–T² graph: a straight line through the origin. The L–T graph is a curve (part of a parabola).
- Value of g: g = 4π²L/T² for each reading. From the graph, g = 4π²/slope if T² is on the y-axis, or 4π² × slope if L is.
- Seconds pendulum: T = 2 s, so T² = 4 s². Its effective length is about 99.3 cm where g = 9.8 m/s².
- Typical result: six lengths from 70 to 120 cm give g ≈ 9.79 m/s².
- Most important precaution: keep the swing small (NCERT says no more than 15°) and time many oscillations, not one.
Where this experiment is in your syllabus
CBSE Class 11 (2026-27). Section A of the practical syllabus has two pendulum experiments. Experiment 7: using a simple pendulum, plot its L–T² graph and use it to find the effective length of the seconds pendulum. Experiment 8: study how the time period of a pendulum of a given length varies when you use bobs of the same size but different masses. In the exam you do two experiments, one from each section, for 7 marks each, and the viva carries 5 marks. Theory: Chapter 13 Oscillations asks for the derivation of the time period.
NCERT. The method is Experiment 6 of the Class XI lab manual, whose suggested extra experiments include finding g from the L–T² graph. The theory is §13.8 of NCERT Physics Class 11, Chapter 13.
ICSE Class 9 (2027). The ICSE Physics syllabus covers the simple pendulum under Measurements: time period, frequency, the graph of l against T² only, its slope, and T = 2π√(l/g) without derivation. Practical 5: time 20 oscillations at lengths of about 70, 80, 90, 100 and 110 cm, plot l against T², draw the best-fit line, find its slope and calculate g = 4π² × slope.
Aim
To study how the time period of a simple pendulum depends on its length, to plot the L–T and L–T² graphs, and from the L–T² graph to find the value of g and the effective length of the seconds pendulum.
Theory: the time period formula
A simple pendulum is ideally a point mass on a massless, inextensible string hung from a rigid support. In the lab, a small heavy bob on a light, strong thread comes close.
When the bob is pulled aside by an angle θ, two forces act on it: the tension along the thread and its weight mg. The component mg sin θ, along the arc, pulls it back toward the mean position. NCERT Class 11 shows that if θ is small, sin θ ≈ θ (in radians), the motion is simple harmonic, and:
T = 2π√(L/g)
Squaring both sides:
T² = (4π²/g) × L
So T² is directly proportional to L. That is why the L–T² graph is a straight line through the origin, while the L–T graph curves (T ∝ √L).
The formula also shows that T depends on L and g only, not on the bob's mass. Four times the length gives twice the period (√4 = 2). And the swing must be small: NCERT's Table 13.1 shows sin θ stays close to θ only up to about 20°.
Effective length. L is measured from the point of suspension (the lower face of the split cork) to the centre of the bob, because the bob's centre of gravity is what swings. NCERT writes L = l + r + e, where l is the thread's length, r the bob's radius and e the hook's length.
Seconds pendulum. A pendulum that takes exactly one second to swing from one extreme to the other, so its time period is 2 s (NCERT lab manual).
Apparatus
NCERT's list for Experiment 6:
- A clamp stand and a split cork
- A heavy metallic (brass or iron) spherical bob with a hook
- A long, fine, strong cotton thread, about 2.0 m
- A stopwatch (least count 0.1 s on a typical analogue one; a stop-clock reads only to 1 s)
- A metre scale (least count 1 mm)
- Graph paper, pencil and eraser
Its procedure also uses a piece of chalk for the mean position, and its note on the bob's radius uses vernier callipers.
Measuring the bob's diameter and the effective length
Bob's diameter. Put the bob between the jaws of the vernier callipers and take three readings in different directions. With a least count of 0.01 cm and no zero error:
| S. No. | Main scale (cm) | Vernier division coinciding | Diameter (cm) |
|---|---|---|---|
| 1 | 1.9 | 9 | 1.9 + 9 × 0.01 = 1.99 |
| 2 | 2.0 | 0 | 2.00 |
| 3 | 2.0 | 1 | 2.01 |
Mean diameter = (1.99 + 2.00 + 2.01) ÷ 3 = 6.00 ÷ 3 = 2.00 cm, so the radius r = 1.00 cm.
Without vernier callipers, NCERT allows placing the bob between two parallel cardboards and measuring the gap.
Hook. Its length e is usually given. Here e = 1.0 cm.
Effective length. L = l + r + e = l + 1.0 + 1.0 = l + 2.0 cm. So for L = 70.0 cm, set the thread to l = 68.0 cm, measured with the metre scale from the cork's lower face to the top of the hook.
Procedure
Based on NCERT Experiment 6.
- Place the clamp stand on the table. Tie the bob's hook to one end of a thread about 150 cm long, and pass the other end between the two halves of the split cork.
- Clamp the cork firmly, with the line between its halves at right angles to the plane of swing. If the stand is shaky, put a heavy object on its base.
- Let the bob hang beyond the table's edge, about 2 cm above the floor. With chalk, draw a vertical line on the table's edge just behind the thread: this marks the mean position.
- Adjust the thread so the effective length is 70.0 cm (l = 68.0 cm here).
- Pull the bob aside by a small angle, not more than 15°, and release it gently, without a push. It must swing in one vertical plane: no spinning, no bouncing, no oval path.
- Let it make a few oscillations. Start the stopwatch as the thread crosses the mean position, say from left to right, and count that as zero.
- Count 1, 2, 3… each time it crosses the mean position in the same direction. Stop the watch at the count n and note the time t. NCERT advises choosing n so that t is 50 s or more; here n = 30.
- Repeat the timing twice more and take the mean. T = mean t ÷ n.
- Change the length by 10 cm and repeat steps 5–8. Take five or six lengths in all (70 to 120 cm here).
- Record everything with units and plot the L–T and L–T² graphs.
ICSE asks for 20 oscillations. Follow your teacher on n.
Observation table
Radius of bob r = 1.00 cm. Length of hook e = 1.0 cm. Least count of metre scale = 1 mm = 0.1 cm. Least count of stopwatch = 0.1 s. Number of oscillations counted, n = 30.
Table 1: Measuring the time period T and effective length L (NCERT Table E 6.1)
| S. No. | Length of thread l (cm) | Effective length L = l + r + e (cm) | t for 30 oscillations (s): (i) | (ii) | (iii) | Mean t (s) | T = t/30 (s) |
|---|---|---|---|---|---|---|---|
| 1 | 68.0 | 70.0 | 50.5 | 50.3 | 50.4 | 50.40 | 1.680 |
| 2 | 78.0 | 80.0 | 53.8 | 54.0 | 53.9 | 53.90 | 1.797 |
| 3 | 88.0 | 90.0 | 57.2 | 57.0 | 57.2 | 57.13 | 1.904 |
| 4 | 98.0 | 100.0 | 60.2 | 60.4 | 60.2 | 60.27 | 2.009 |
| 5 | 108.0 | 110.0 | 63.3 | 63.1 | 63.2 | 63.20 | 2.107 |
| 6 | 118.0 | 120.0 | 65.9 | 66.1 | 65.9 | 65.97 | 2.199 |
These are the times a pendulum gives where g = 9.8 m/s², with the scatter hand timing adds. Your readings will differ.
Calculation: finding the value of g
Mean time and T. Row 3: (57.2 + 57.0 + 57.2) ÷ 3 = 171.4 ÷ 3 = 57.13 s, and T = 57.13 ÷ 30 = 1.904 s. The other sums are 151.2, 161.7, 180.8, 189.6 and 197.9 s, each divided by 3, then by 30.
g for each length. From T² = 4π²L/g:
g = 4π² × L/T², with 4π² = 4 × (3.1416)² = 39.48 and L in metres.
Table 2: T², L/T² and g
| S. No. | L (cm) | T (s) | T² (s²) | L/T² (cm/s²) | g = 4π² × L/T² (m/s²) |
|---|---|---|---|---|---|
| 1 | 70.0 | 1.680 | 2.822 | 24.81 | 9.79 |
| 2 | 80.0 | 1.797 | 3.229 | 24.78 | 9.78 |
| 3 | 90.0 | 1.904 | 3.625 | 24.83 | 9.80 |
| 4 | 100.0 | 2.009 | 4.036 | 24.78 | 9.78 |
| 5 | 110.0 | 2.107 | 4.439 | 24.78 | 9.78 |
| 6 | 120.0 | 2.199 | 4.836 | 24.81 | 9.79 |
Worked through for row 1:
- T² = 1.680 × 1.680 = 2.822 s²
- L/T² = 70.0 ÷ 2.822 = 24.81 cm/s² = 0.2481 m/s²
- g = 39.48 × 0.2481 = 9.79 m/s²
Units check: m ÷ s² = m/s². Correct.
L/T² stays between 24.78 and 24.83 cm/s²: that constant ratio shows T² ∝ L.
Mean g = (9.79 + 9.78 + 9.80 + 9.78 + 9.78 + 9.79) ÷ 6 = 58.72 ÷ 6 = 9.79 m/s²
That is within 0.1% of 9.8 m/s²: (9.80 − 9.79) ÷ 9.80 = 0.001.
Plotting the L–T² graph
Axes. NCERT puts L on the x-axis and T² on the y-axis. Here 1 cm = 10 cm of length (0 to 130 cm) and 1 cm = 0.5 s² (0 to 5.0 s²). Start both axes at zero, so the line can be seen to pass through the origin.
Plot the six points (L, T²) from Table 2 and draw one straight line through the origin, as close to all of them as possible. Do not join the dots.
The L–T graph. Plotted the same way from Table 1, it is a curve, part of a parabola, since T ∝ √L. A straight line is far easier to read and extend, which is why you use L–T².
g from the slope. Take two points far apart on the drawn line, not data points. Here the line passes through (60 cm, 2.420 s²) and (120 cm, 4.840 s²):
Slope = ΔT² ÷ ΔL = (4.840 − 2.420) ÷ (120 − 60) = 2.420 ÷ 60 = 0.04033 s²/cm = 4.033 s²/m
Since T² = (4π²/g) L, the slope is 4π²/g, so:
g = 4π² ÷ slope = 39.48 ÷ 4.033 = 9.79 m/s²
This agrees with Table 2. Plotted the other way round, with L on the y-axis as ICSE does, the slope is L/T² (about 0.248 m/s²) and g = 4π² × slope = 39.48 × 0.248 = 9.79 m/s². Check your axes before you divide or multiply.
Seconds pendulum from the graph. Draw a horizontal line from T² = 4.00 s² on the y-axis to the line, then drop down to the L-axis. Here:
L = T² ÷ slope = 4.00 ÷ 0.04033 = 99.2 cm
Check with the formula, as in NCERT Example 13.8: L = gT²/4π² = (9.8 × 4) ÷ 39.48 = 0.993 m = 99.3 cm, which NCERT rounds to 1 m.
Result
- The L–T graph is a curve, convex upwards. The L–T² graph is a straight line through the origin, so T² ∝ L.
- Acceleration due to gravity: mean of 4π²L/T² = 9.79 m/s². From the slope of the L–T² graph = 9.79 m/s².
- Effective length of the seconds pendulum, from the graph at T² = 4 s²: 99.2 cm.
Precautions
- Rigid support. Clamp the split cork firmly and weigh down a shaky stand.
- Small amplitude. No more than 15°; 5° to 10° is better. T = 2π√(L/g) holds only for small angles.
- Release gently, in one vertical plane, so the bob does not spin or move in a cone.
- Use unspun cotton thread, thin, light and strong, not nylon: a stretchy string changes the effective length.
- Measure L to the centre of the bob, and include the hook.
- Start and stop the watch at the mean position, counting crossings in the same direction, the first one as zero.
- Time many oscillations (t of 50 s or more) and repeat each timing.
- Switch off fans and avoid draughts. Air currents push the bob off its plane.
- Safety: keep the bob's path clear of people and keep your feet out from under a heavy brass bob. Tighten the clamp before you release it.
Sources of error and common mistakes
- Counting "one" as you start the watch gives n − 1 oscillations, so T comes out too small.
- Counting half-swings. One oscillation is there and back: two crossings of the mean position.
- Leaving out the radius or the hook. Using the thread length l for L makes every L about 2 cm too short here, and g too small.
- A big swing. The period grows with amplitude: about 0.05% longer at 5°, 0.43% at 15° and 0.77% at 20°. Since g ∝ 1/T², a 20° swing makes g about 1.5% too small. HyperPhysics puts the error under one percent for amplitudes below about 22°.
- Reaction time. A delay of about 0.2 s in pressing the watch is 0.2 ÷ 50.4 = 0.4% of a 30-oscillation time, but would be 0.2 ÷ 1.68 = 12% of a single period. T² doubles the percentage error, which is why NCERT stresses accurate timing.
- Air drag and buoyancy make T slightly longer; a small, dense bob reduces this.
- Joining the dots, or taking the slope from two data points instead of the line.
Viva questions with answers
- What is a simple pendulum? A heavy point-like bob hung from a rigid support by a light, inextensible string, free to swing in a vertical plane.
- What is the effective length? The distance from the point of suspension to the centre of the bob: L = thread + radius of bob + length of hook.
- Why do we keep the amplitude small? The formula needs sin θ ≈ θ, which holds only for small angles. Then the motion is simple harmonic and T = 2π√(L/g).
- Why time 20 or 30 oscillations instead of one? Your reaction-time error is fixed, so spreading it over many oscillations makes it a much smaller part of each period.
- Why start timing at the mean position? The bob moves fastest there, so the instant it passes is easiest to judge. At an extreme it slows to rest and the moment is hard to pick.
- What is the shape of the L–T and L–T² graphs? L–T is a curve (part of a parabola). L–T² is a straight line through the origin.
- How do you find g from the L–T² graph? With T² on the y-axis, slope = 4π²/g, so g = 4π²/slope. With L on the y-axis, g = 4π² × slope.
- What is a seconds pendulum, and how long is it? One whose time period is 2 s. Its length is gT²/4π², about 99.3 cm (about 1 m) where g = 9.8 m/s².
- Does a heavier bob swing faster? No. Mass does not appear in T = 2π√(L/g). CBSE Experiment 8 tests this with bobs of the same size and different masses.
- What happens to T on the Moon, where g is about one-sixth? T ∝ 1/√g, so T becomes √6 ≈ 2.45 times longer.
Try it in 3D
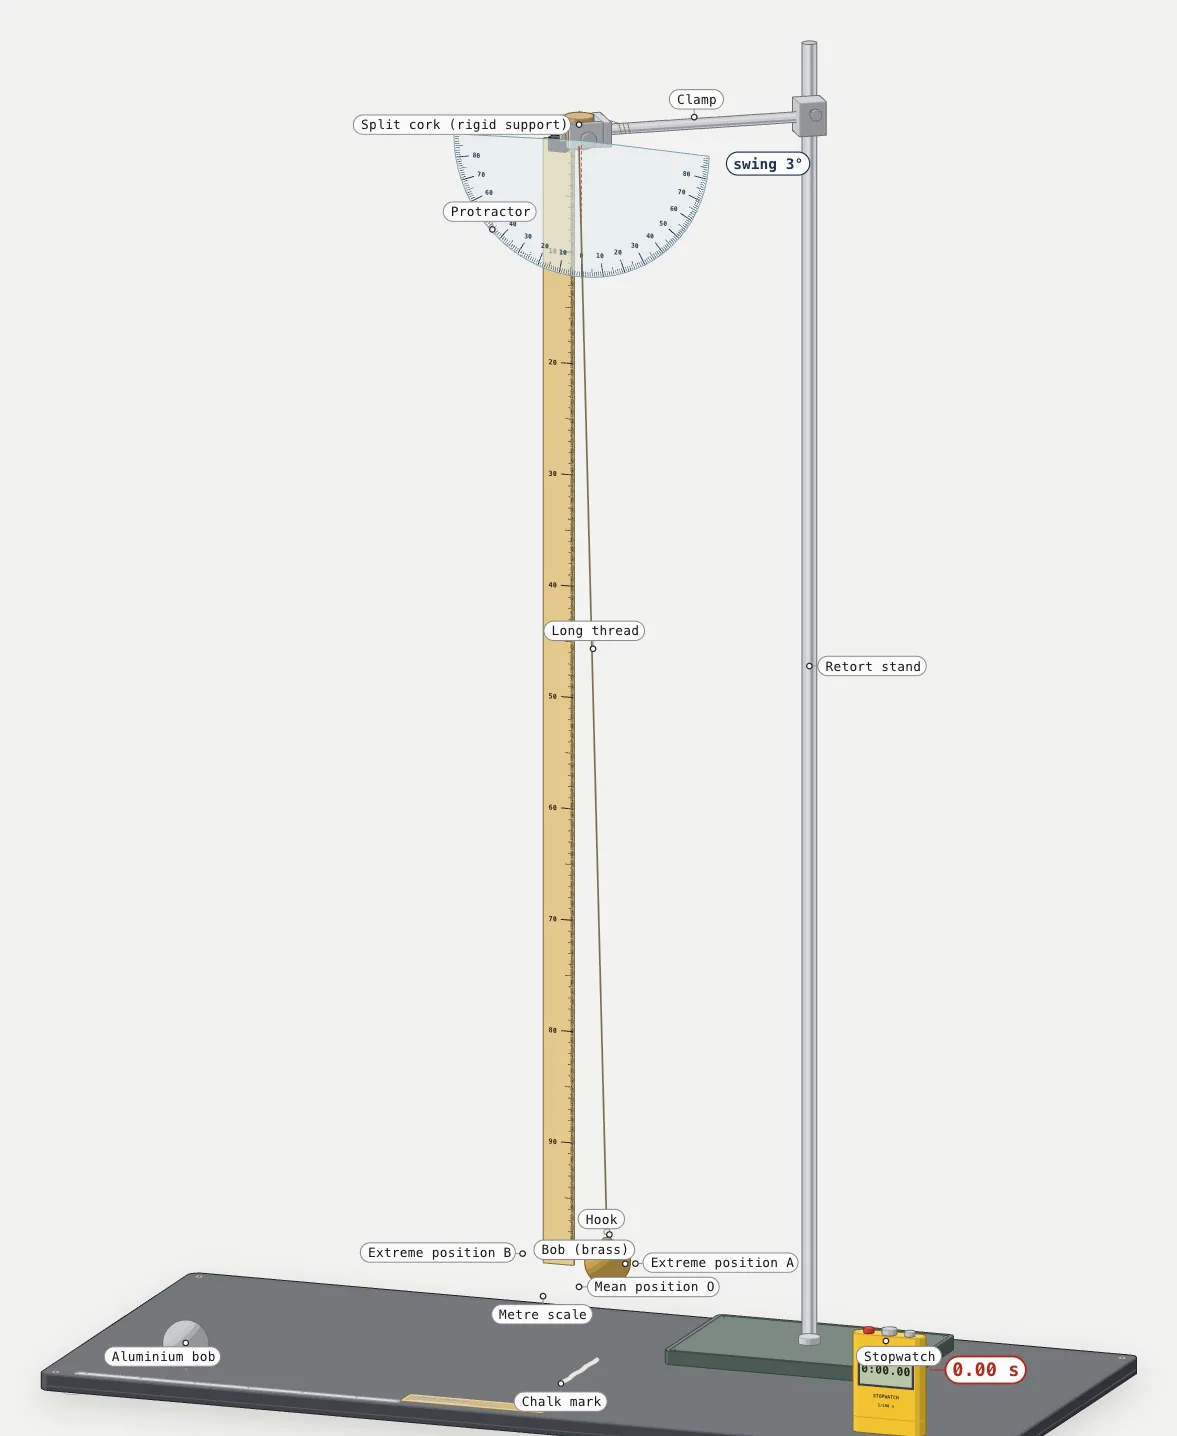
Student Intelligence has a free 3D version of this bench at /labs/simple-pendulum. A brass bob 4.0 cm across, with a 1.0 cm hook, hangs on a cotton thread from a split cork in a retort stand. A metre scale beside the thread reads the effective length to the bob's centre, a clear protractor at the point of suspension reads the angle, a chalk mark shows the mean position, and a digital stopwatch reads to 0.01 s.
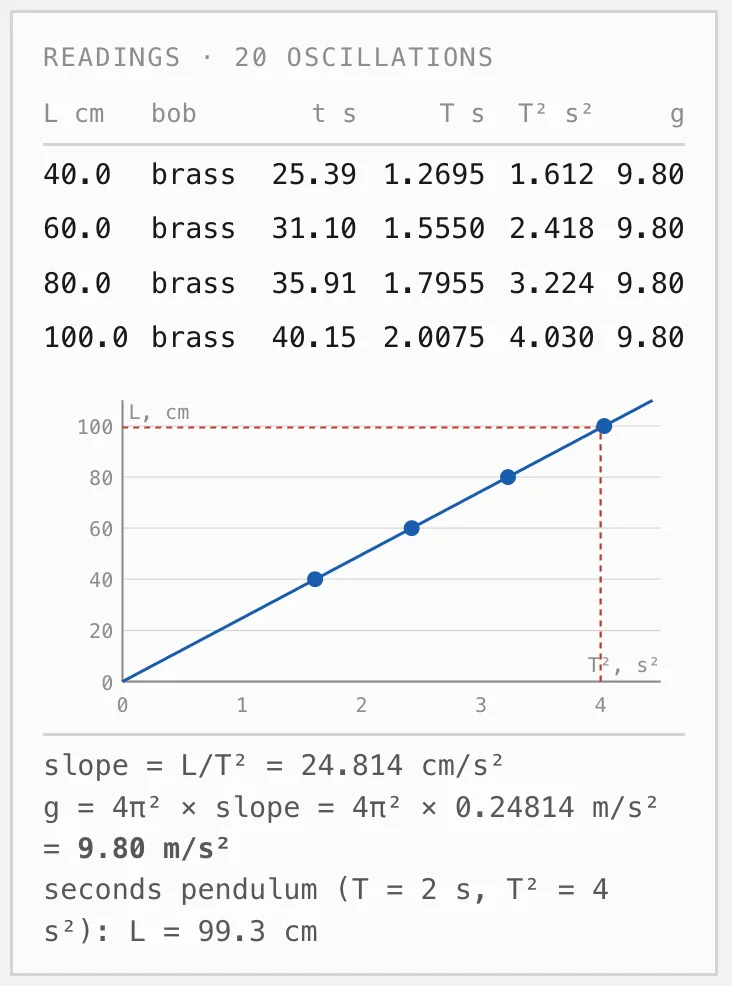
You can set the effective length to 40, 60, 80 or 100 cm, swap in an aluminium bob of the same size (about a third of the mass), and choose a 3° or a 20° swing. The bench breaks the effective length into thread + hook + radius and times 20 oscillations from the mean position. Each timing fills a readings table (L, t, T, T², g) and an L–T² graph, with T² across and L up, so g = 4π² × slope; it also reads the seconds pendulum at T² = 4 s². A 20° timing is marked and left off the line, because it gives a lower g.
The bench, its controls, and a short quiz and flashcards are free without an account. Doing the experiment step by step with the voice tutor needs a free sign-in.
FAQ
Why is the L–T² graph a straight line?
Squaring T = 2π√(L/g) gives T² = (4π²/g) L. Since 4π²/g is a constant at one place, T² is directly proportional to L, and a graph of two directly proportional quantities is a straight line through the origin.
Does the time period of a simple pendulum depend on the mass of the bob?
No. For bobs of the same size, T stays the same whatever their mass, because mass is not in the formula. The size does matter a little: a bigger bob moves its centre further down, which changes the effective length.
How do you find the value of g using a simple pendulum?
Find T at several effective lengths. Work out g = 4π²L/T² for each and take the mean, or plot L against T² and use the slope. A careful school experiment gives about 9.8 m/s².
What is the effective length of a seconds pendulum?
About 99.3 cm, where g = 9.8 m/s². In the practical you read it off the L–T² graph at T² = 4 s²; anything from about 99 to 100 cm is a good result.
Practising before your practical? Student Intelligence's free 3D lab lets you time the pendulum and draw the L–T² graph yourself.
Sources
- NCERT. Laboratory Manual Physics, Class XI, Experiment 6: simple pendulum, L–T and L–T² graphs, seconds pendulum (procedure, Table E 6.1, discussion, additional experiments). https://ncert.nic.in/pdf/publication/sciencelaboratorymanuals/classXI/physics/kelm103.pdf
- NCERT. Laboratory Manual Physics, Class XI, Experiment 1: vernier callipers, least count and zero error. https://ncert.nic.in/pdf/publication/sciencelaboratorymanuals/classXI/physics/kelm102.pdf
- NCERT. Physics, Part II, Textbook for Class XI, Chapter 13 "Oscillations" (Reprint 2026-27): §13.8 The simple pendulum, Table 13.1, Example 13.8. https://ncert.nic.in/textbook/pdf/keph206.pdf
- CBSE. Curriculum 2026-27, Physics (042), Classes XI–XII: Class XI Chapter 13, practical evaluation scheme, Section A Experiments 7 and 8, Activity 7. https://cbseacademic.nic.in/web_material/CurriculumMain27/SecPart2/Physics_SecP2_2026-27.pdf
- CISCE. ICSE 2027 Physics syllabus: Class IX, Measurements and Experimentation; Internal Assessment Practicals 4 and 5. https://cisce.org/wp-content/uploads/2025/03/10.-Physics.pdf
- Nave, R. HyperPhysics: Simple pendulum, large-amplitude period. Georgia State University. https://hyperphysics.gsu.edu/hbase/pendl.html